| « previous section | next section » |
The presentation of the notion of graph will be preceded by a
short story which is often cited on this occasion. Namely, the Swiss
mathematician Leonard Euler, during his time in Konigsberg, had a
habbit of going for long walks around the city. The city is located on
both banks of river Pregoła and on her two islands, and is spanned by
seven bridges, see Figure 2.5.1. Euler tried to find such a tour which
would permit him to traverse each bridge one time and go back home. The
solution of the problem of Konigsberg bridges appeared in the Euler's
paper
published in 1736 year, giving the beginning of new branch of
mathematics - the theory of graphs. (We will return to the problem of
Konigsberg's bridges once again somewhat later.)
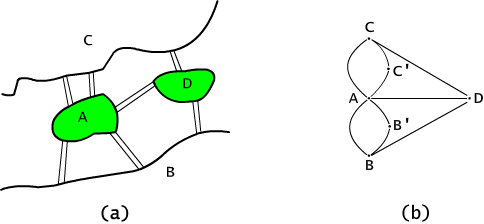
Fig. 2.5.1 (a) Draft of the plan of Konigsberg and (b) the corresponding graph.
In this lecture we will talk about simple graphs. They are geomerical shapes built of the points and lines, or arrows joining some of them. We have illustrated relations in this way. The formal definition follows.
Definition 2.5.1
A directed simple graph G is an orderd pair (V,E), where V is a nonempty set and E is a subset of the Cartesian product V x V. The elements of the set V are called the vertices (or nodes) of a graph G and the elements of the set E are called the edges (or arcs) of the graph.
Each simple graph determines uniquely the binary relation r in the set of all vertices V,
(x, y) ∈ r iff (x, y) ∈ E.
Conversely, each binary relation r in any set X determines a graph the nodes of which are the elements of the set X and the edges are ordered pairs that belong to r. In general, we will consider the finite graphs, which means that the set of veritices will be finite.
The typical examples of graphs are nets: e.g. the water-supply
network,
telecommunicational network, etc. Several examples of graphs have
already
been
introduced as illustrations of binary relations. On drawing Fig. 2.5.2
we
will introduce one more example: representing the net of road
connections. On this example we will explain some basic notions
related with graphs.
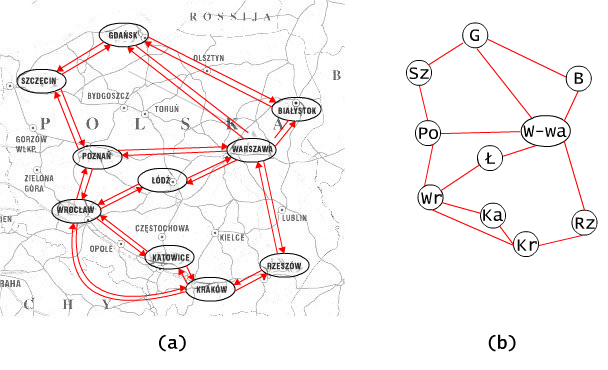
Fig. 2.5.2 A net of road connections.
Please mark, that by the definition of a graph, any two nodes can be connected by one edge at most.
Definition 2.5.2
Let G = <V, E> be a simple graph. We will call the nodes
adjacent iff there is an egde
between these two nodes.
A path in a graph G is a sequence of nodes v0,v1,...vn,
such that the consequtive nodes vi, v i+1
are adjacent, i.e. (vi
, vi+1 ) ∈ E for all
i = 0, 1, ..., n-1. The number of edges in a path is called the length
of the path. If in a path v0, v1, ...vn,
the first and the last elements are identical, v0 =
vn, we say that the path is closed. If all the vertices of
the closed path are different thenthe path is called a cycle (or
circuit).
In other words, a path is a route that you travel along edges and through nodes in a graph. All of the vertices and edges in a path are connected to one another. A cycle is a path which begins and ends on the same vertex. The sequence of nodes WR, Ł, W-wa, G, is a path of the length 3 in the graph presented on picture 2.5.2. On the other hand, the path W-wa, G, Sz, Po, Wr, Ł, W-wa is a cycle of the length 6.
Question 2.5.1 Is the length of the path equal to the number of vertices of this path?
Example 2.5.1
Let us consider the following algorithm:
{max := a[0]; i := 1; while i ≤ n do if max<a[i] then max := a[i] fi ; i := i+1 od},
in which we have two assignment instructions and one loop. The
flow-diagram of this program is presented in Figure 2.5.3. It is a
graph
with two distinguished nodes "start" and "end". Start-node indicates
the state in which no instruction of the program has yet been executed.
End-node indicates the state in which all instructions of the program
have been executed. All other nodes contain either an assignment
instruction, that ought to be executed at this moment, or a test that
must be verified. The arcs show the order in which the actions have to
be executed. Some arcs (i.e. edges of the graph) have words "YES"
and "NO" assigned to them. They indicate the way of continuation of the
execution, in the
case, when the
result of the test is positive ("YES") and negative ("NO").
I hope that the Reader will agree that this way of explaining
algorithms, agrees with our intuition and helps to understand
the structure and the semantics of the program. Having a sequence of
values a[0], a[1], ..., a[n] for some n, one can
investigate on this graph each possible execution of the
algorithm. Nota bene: What does this algorithm do?
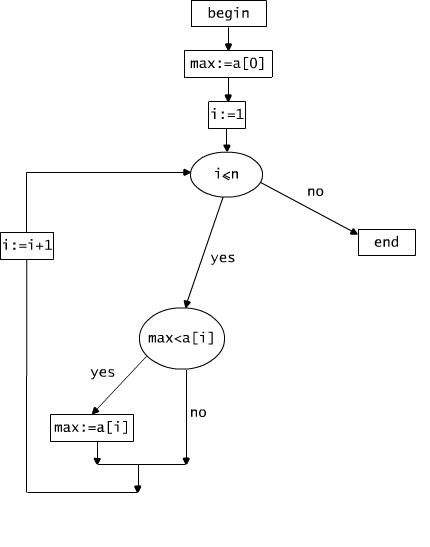
Fig. 2.5.3 Flow-diagramm of a program.
Question 2.5.2 Present an example of data, for which the
realization of the above algorithm corresponds to the path
1,2,3,4,5,7,4,5,7,4, 8.
Example 2.5.2
Let's assume that you, dear Reader, as a boss of a construction company received an order to build a house. How will you organize this work? At the beginning you will probably establish what actions should be undertaken. Obviously some of them can be executed simultaneously, e.g. by different experts. But some of them have to be executed in the fixed order. For example first we have to build foundations, and later walls. In general there is a lot of actions. How can we proceed? A simple solution is to draw a graph; see Figure 2.5.4. The nodes of this graph correspond to the actions, and edges will establish in what order one should execute them. This graph will not only permit to embrace the whole of the undertaking at one glance, but also to plan deadlines of beginning and end of individual tasks, to optimize the time and effort.
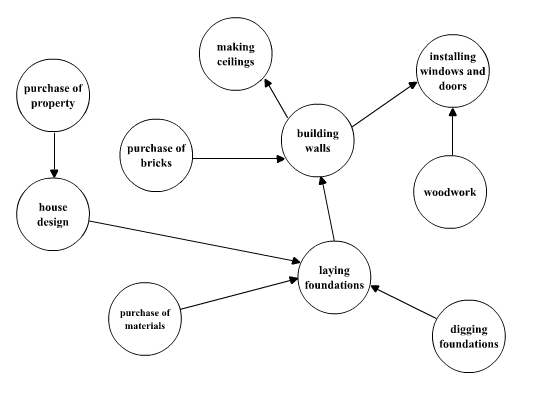
Fig. 2.5.4 The graph of actions during the house construction.
Definition 2.5.3
We
say that a graph G = <V, E> is undirected, if for any two
nodes v, v' ∈ V,
Let's
notice that undirected
graphs correspond to
the symmetric relations.
If an edge from v to v' exists then
there is an edge from v' to v. The example of such a graph is
presented on Fig. 2.5.2 (a). Talking
about undirected graphs, we
usually simplify drawing just replacing arrows with lines (see Fig. 2.5.2
(b)).
Thus, one can consider
edges as two - element
sets, and not ordered pairs. The notions of path and of
cycle in undirected graphs
stay the same. The degree
of a vertex in an undirected
graph is the number of edges that are adjacent to this node. On
Fig. 2.5.2 (b), the
degree of a node W-wa is 5.
Definition 2.5.4
We
say that an undirected graph is connected iff every
two nodes of this graph are connected by a path.
We say that an undirected graph is acyclic iff it has no
cycle.
Let’s come back for a moment to the problem of
Theorem 2.5.1
The sufficient and necessary condition that a finite, undirected,
and
connected graph has an Euler-cycle is that the degree of every node is
even.
The sufficient and necessary condition that a finite, connected, and undirected graph has an Euler path connecting nodes A and B is that the only nodes of odd degree are A and B.
The Euler's criterion, formulated in the theorem 2.5.1, is very
simple. When the degree of each node is even, then the graph has
an Euler's cycle and an Euler's path. If there are nodes of odd
degree, then either there are exactly two of such nodes and then the
graph has Euler's path joining these nodes and has no cycle, or there
is no Euler's path in this graph.
Question 2.5.3
Check, in which of the graphs introduced on Fig. 2.5.5 there exists
an Euler's
cycle or a path. Remark: if a graph has an Euler's cycle or a path then
one can draw it without lifting the pencil from the paper. Have
fun!
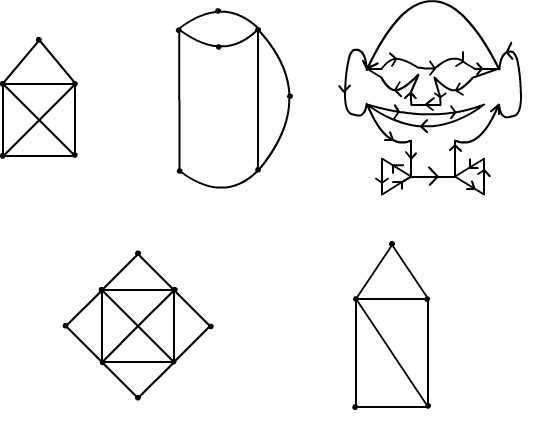
Fig. 2.5.5 Examples of graphs.
Example 2.5.4
Consider a tournament in which 8 teams are playing. Games go
in rounds in which teams play in pairs. Only the teams who won in
a previous round, proceed to the next round. All games of this
tournament can be presented in the form of a graph; see Fig. 2.5.6. The
nodes of a graph (numbered from 1 to 8) correspond to the teams taking
part in consecutive games (denoted by letters). Edges going out from
two nodes
x and y meet in a node z only when the teams x,y were playing and z is
the vinner. For example, the game of teams 5 and 6 finished with
the victory of team 6.
The last round permits to determine out who is the winner of the
tournament
(Team 6 in our example won).
Fig. 2.5.6 The graph of games in a tournament.
The graph, presented on the figure Fig. 2.5.6 has a particular
shape, that is characteristic for some type of graphs. One can observe
that this graph has no cycle and any two nodes are connected by only
one path.
Question 2.5.4 What is the smalest number of edges that
an undirected
connected graph may have? What is the maximum number of
edges of an
acyclic graph?
Remark Each node, with the exception of root, has only one
father.
Problem
Draw your family tree in a way, to make your grandfather a root.
Example 2.5.5
Each arithmethic expression may be pictured in the form of a tree.
In
such a tree the variables or constants of the expression are leaves,
the inner nodes are the executed operations, and the arguments of the
operations are edges. In the Fig. 2.5.7 there is a tree representing
the
expression (x + y) * √ z . On this tree one
can clearly see what must be the order of executing the operations. The
root
of the tree is marked with muliplication since it is the main operation
in this expression.
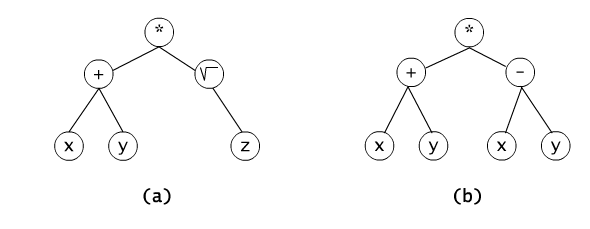
Fig. 2.5.7 The tree on the arithmetic expression (x + y) * √z.
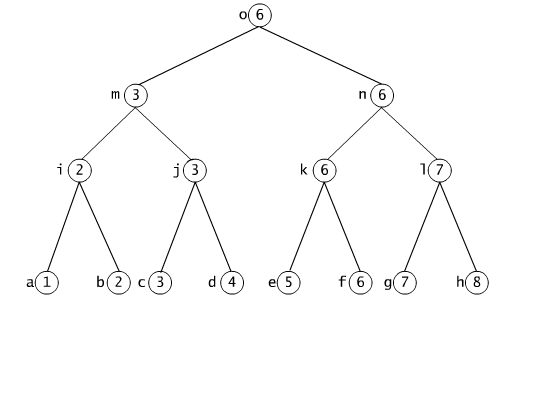
The lenght of the longest path from the root to the leaf is called
the height of the tree. If each node of a tree has at the most
two successors, then such a tree is called a binary tree. Since each
node
in
the trees shown in the Fig. 2.5.6 and 2.5.7
has two sons at the most, then those trees are binary. The height of
the tournament tree is 3, and the tree form the graph 2.5.7 is 2.
The tree in the Fig. 2.5.8(b) is not binary. It depicts a part of the graph of the possible stuations in the Shannon game described below (Fig. 2.5.8). The edges of the tree mark possible moves of the players, i.e. the choices of arcs.
The Shannon game
Let's look at a given undirected, connected graph G and its two marked nodes A and B. Two players are making moves in turns. Player 1 in each moves reinforces (by marking with thicker line) on of the edges. Player 2 in each move deletes (by striking trough) one of the not reinforced edges of the graph.
The aim of the player 1 is to build a path connecting the nodes A
and
B. The aim of the player 2 is to make this task impossible. The player
who achieves his gloal first wins the whole game. Have fun.
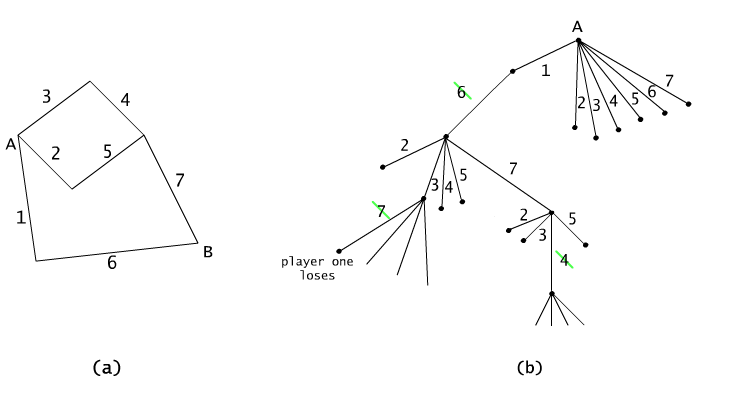
Fig. 2.5.8 Part of the graph of the possible situations in the Shannon game.
| « previous section | next section » |